What you can ask the AI chart generator to do
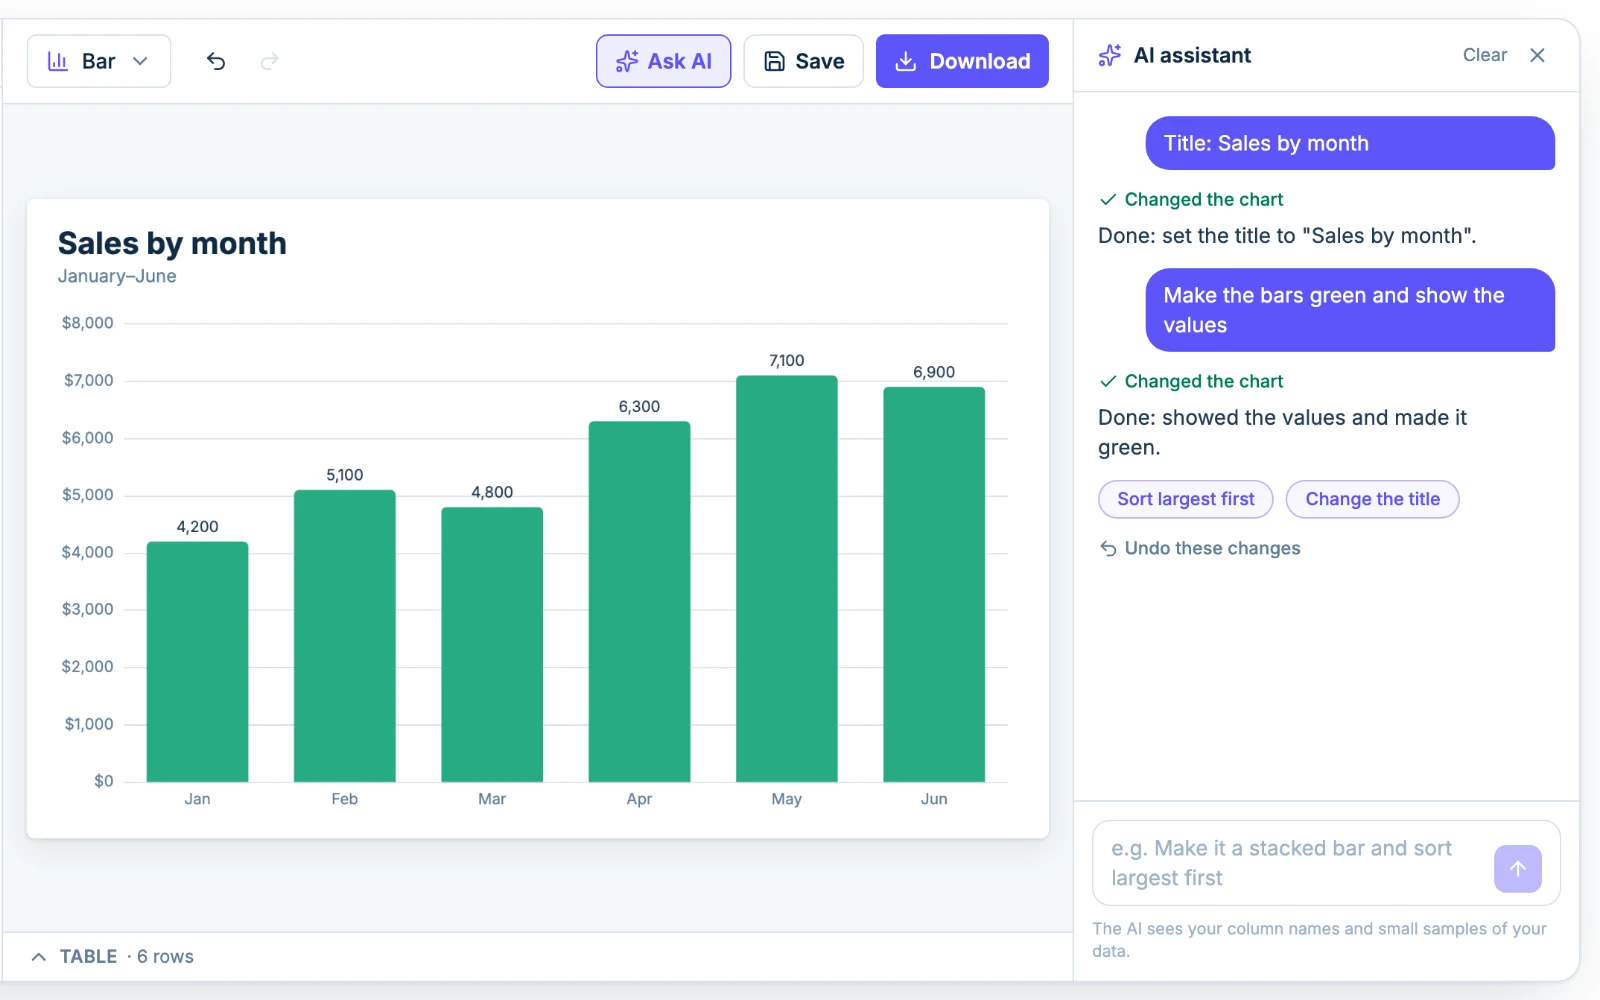
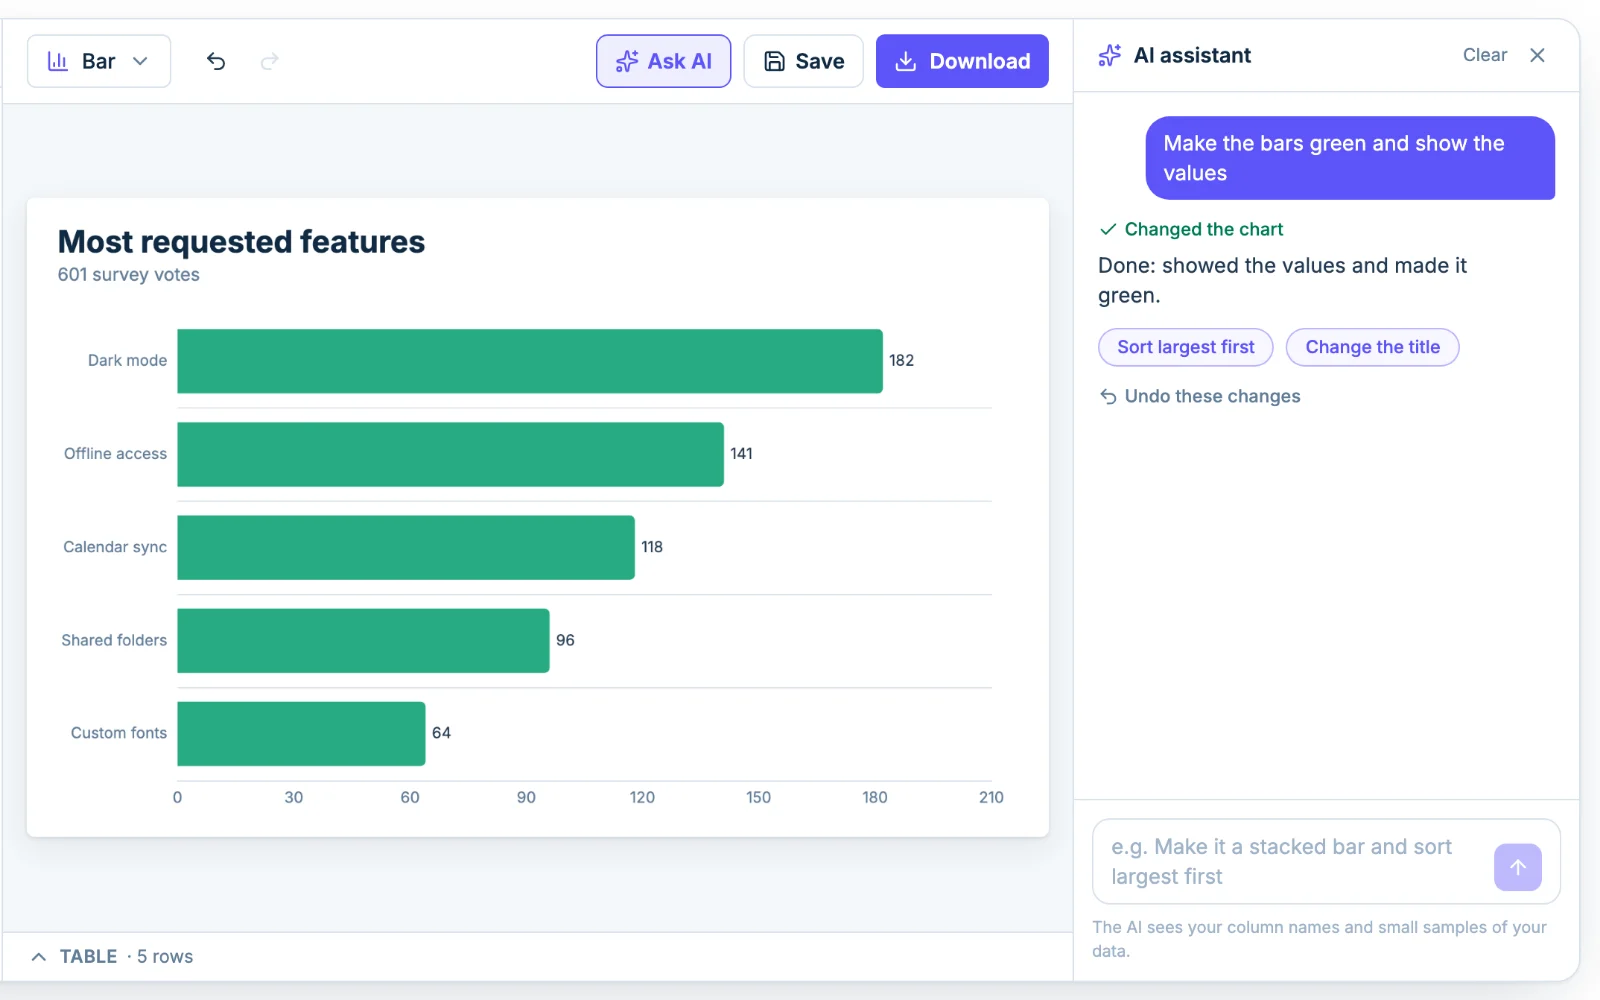
The assistant edits the chart that is open in the editor. Ask the way you would ask a person:
- "Make it a line graph." It switches between the 10 chart types and keeps your data.
- "Sort largest first and keep the top 5." It adds Sort and Top N steps on the Data tab. Steps change what is charted and leave your data as it was.
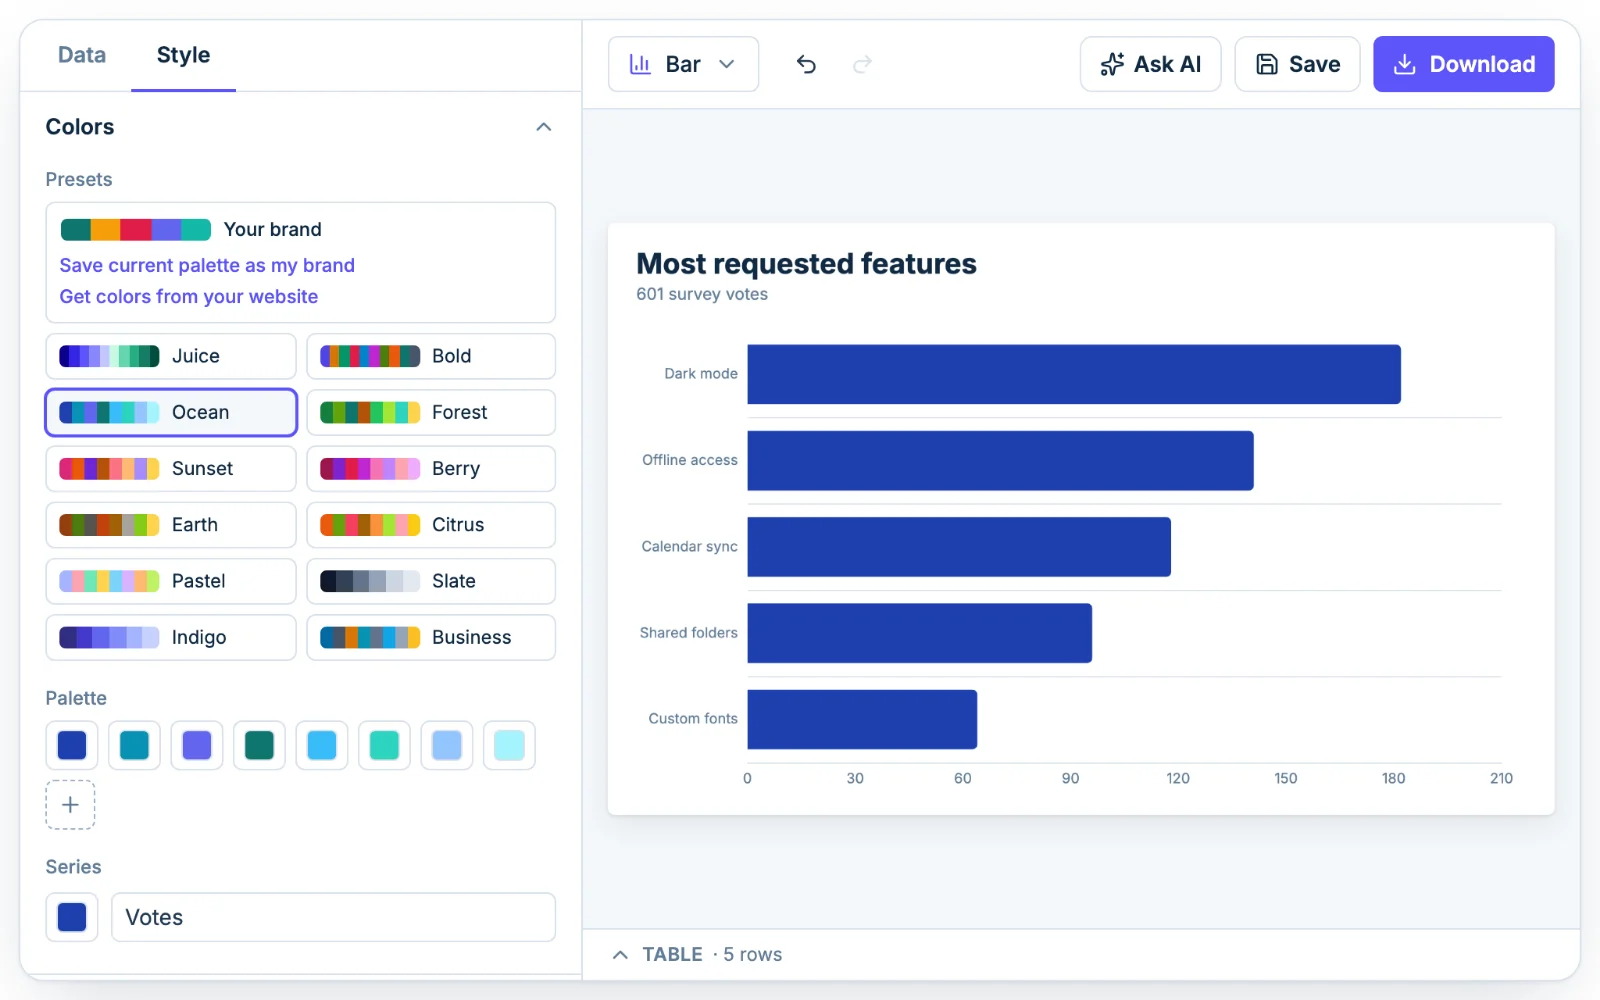
- "Title it Q3 survey results and make the bars dark green." Titles, axis titles, the legend, value labels, number formats and colors can all be set this way.
- "Is this chart easy to read?" It checks for problems such as too many slices or an axis that does not start at zero.
- "Where do I change the legend?" It opens that section of the Style tab and highlights it.
When a request could mean two things, it asks a short question and gives you buttons to answer with. Each request is one undo step, and everything it changes is a normal setting you can adjust by hand.
What this AI graph generator can't do
It works from your numbers. It does not look anything up, so it cannot find last year's sales or a country's population for you. If you ask for sample data, it fills the table with made-up numbers and says they are made up.
It also does not:
- plot an equation such as y = 2x + 1. Chartjuice charts tables of data.
- draw flowcharts, org charts, Gantt charts or maps.
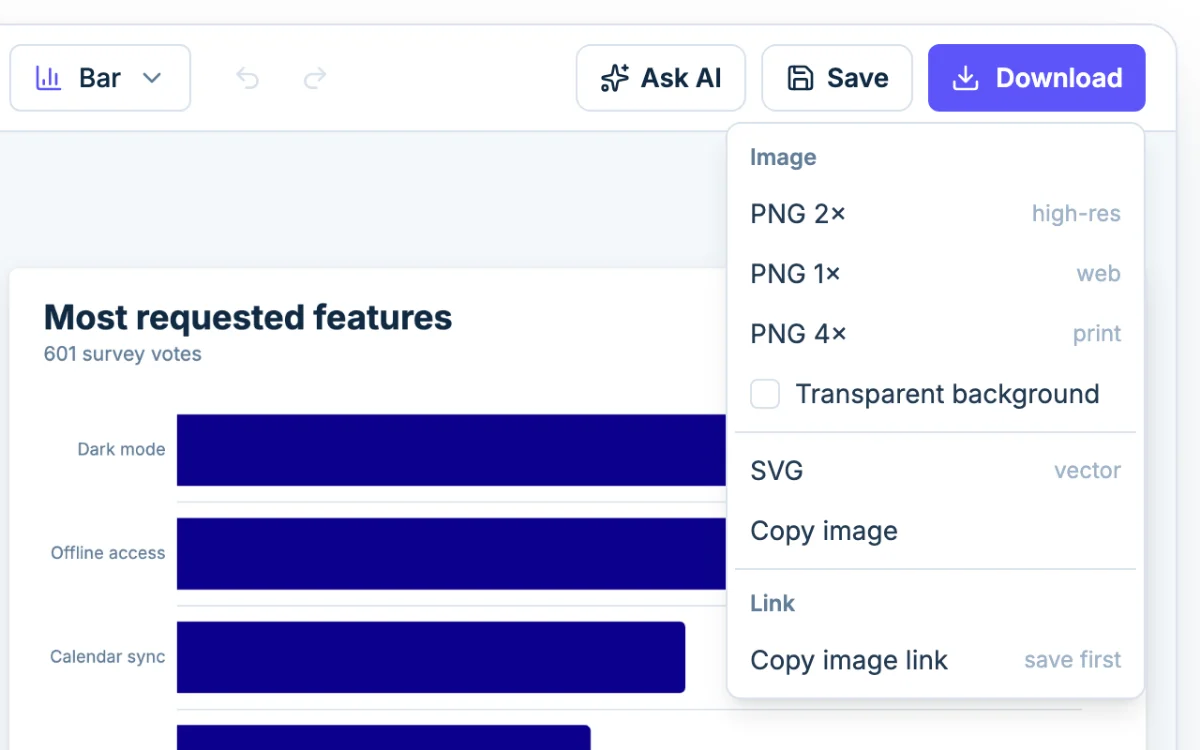
- connect to a database or a live spreadsheet. You download the chart as a PNG or SVG.
- write a report about your data. Its replies are short notes on what it changed.
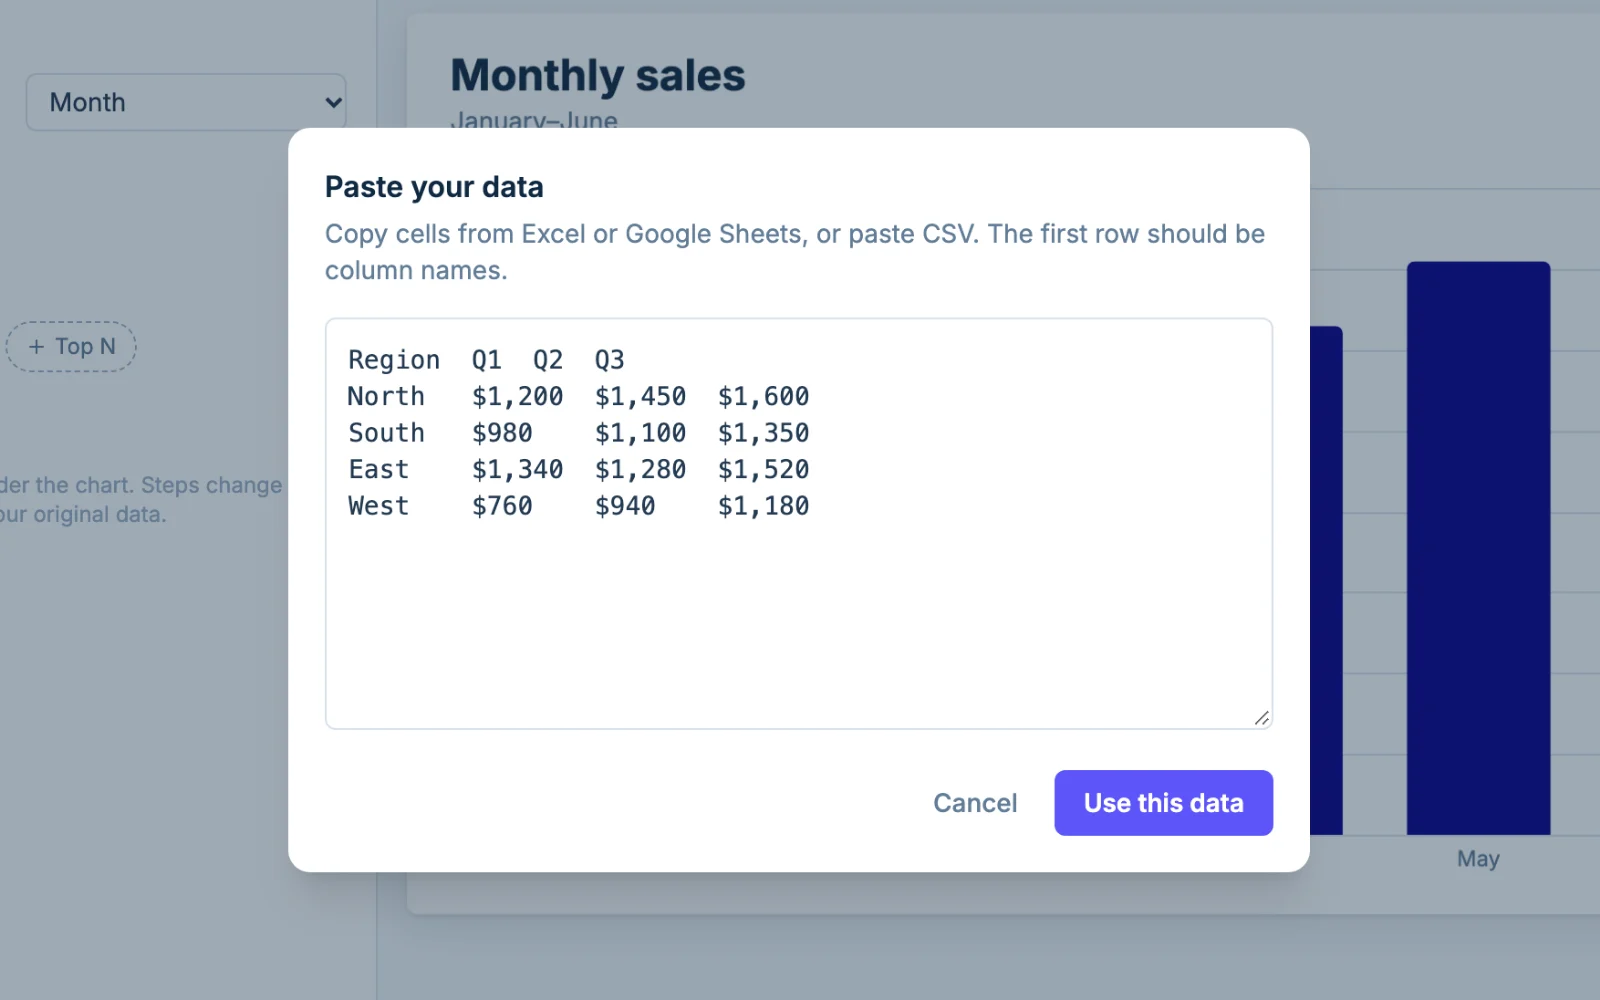
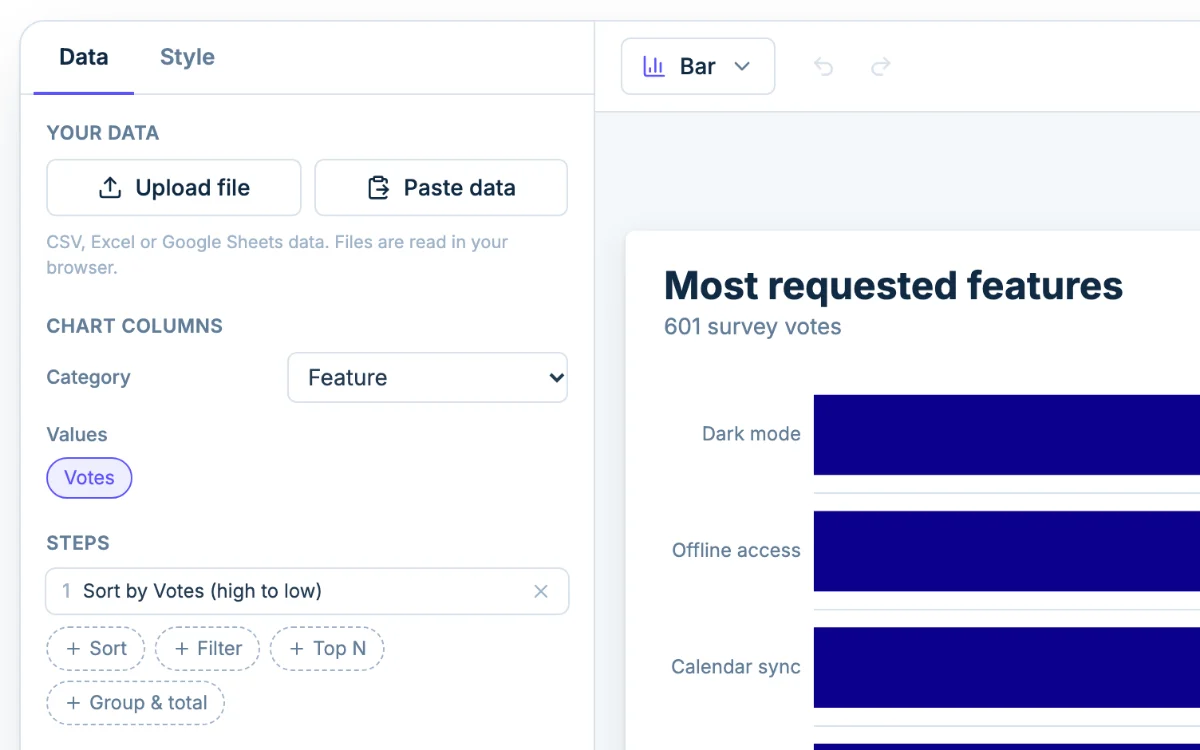
Requests are short, so add your table with Paste data or Upload file.
What the AI costs
The assistant needs a free account, which gets 3 tries in total, not per day. Each message you send uses one. After that the assistant is part of Pro: 50 messages a day for $12 a month or $120 a year. The designer itself stays free with no signup. See pricing.
Connect Claude, ChatGPT or another assistant
If you already use an AI assistant, you can connect it to Chartjuice and ask for charts in your own chat. The assistant makes the chart in your Chartjuice account, shows it to you as a picture and gives you a link that opens it in the editor.
- Give your assistant this address:
https://chartjuice.com/mcp. In Claude, open Customize, then Connectors, choose Add, then Add custom connector, and paste it. Connect an AI assistant has the steps for ChatGPT, Claude Code, Cursor and VS Code. - Your assistant sends you to Chartjuice. Sign in there, or make a free account.
- Check that the page names your assistant, and choose Allow.
There is no key to copy and nothing to install. Connecting is part of every plan, Free included, within your plan's limits. Limits and errors has the numbers.
Ask AI or your own assistant: which should you use?
| Ask AI in the editor | Your own assistant, connected | |
|---|---|---|
| Where you type | In Chartjuice, beside the chart | In Claude, ChatGPT or another assistant |
| What it works on | The chart open in the editor | New charts from data you give it, and charts saved in your account |
| What Chartjuice charges | 3 tries with a free account, then Pro | Nothing extra on any plan |
| Limits on Free | 3 tries in total | Up to 5 saved charts and 100 chart pictures a day, with the chartjuice.com mark |
| Where your data goes | To Chartjuice. The AI model sees column names and small samples | To the company that makes your assistant, and to Chartjuice |
Use Ask AI for a quick change while you are looking at the chart. Use your own assistant when the data is already in a chat, or when you want several charts in a row.
AI bar graphs, pie charts and other chart types
Ask AI is in the toolbar of every maker page, so you can start from the chart you need.
Bar graph maker with AI
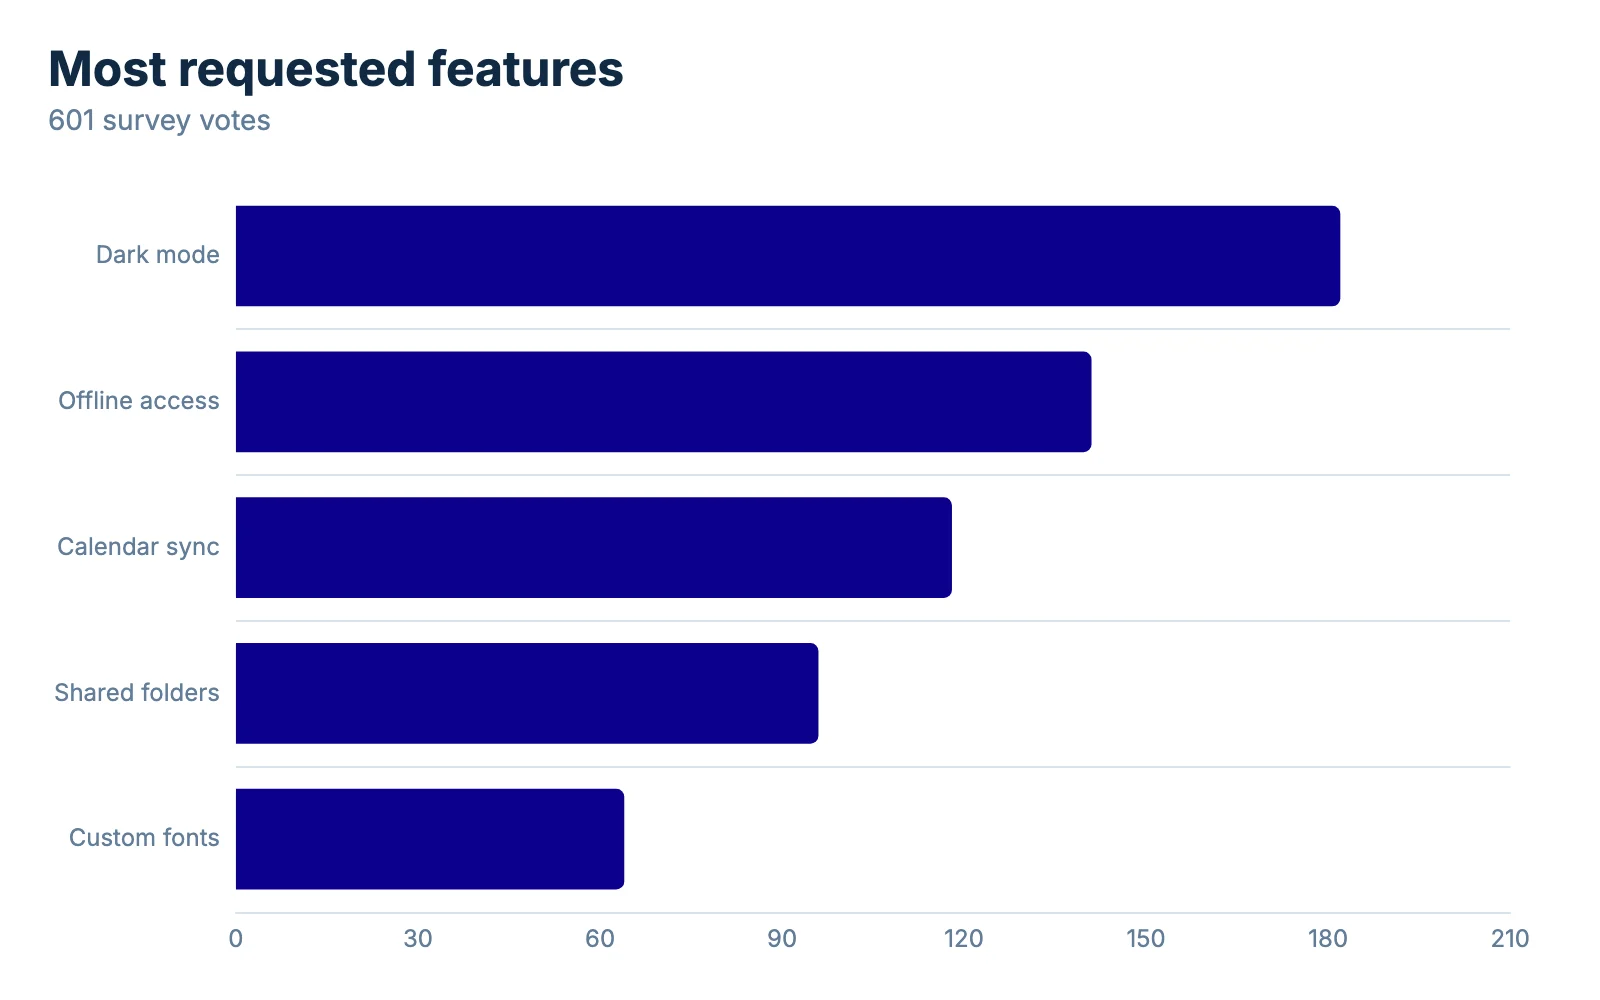
Open the bar graph maker, paste a column of names and a column of numbers, and ask it to "turn the bars sideways and sort largest first". Sideways bars leave room for long names, such as survey answers. With two or more number columns, ask for stacked bars or bars side by side.
AI pie chart generator
On the pie chart maker, ask for a donut, or for percent labels on the slices. A pie with more than six slices is hard to read, so ask it to keep the top five and group the rest as Other. To compare slices that are close in size, ask for a bar graph.
Line graphs and scatter plots
On the line graph maker, ask for an area chart or a smoother line. On the scatter plot maker, ask for a trend line, and it draws a least-squares line of best fit.