Chart images
An image link is a web address that shows one of your charts as a picture. Paste it into an email, a Notion page or a website and the picture stays current: when you edit the chart, the picture changes with it. If you write code, the image API further down draws charts as PNG or SVG from your own data.
On this page
Put a live chart in an email or a Notion page
You need a chart saved to your Chartjuice account. A free account is enough.
- Open the chart in the editor.
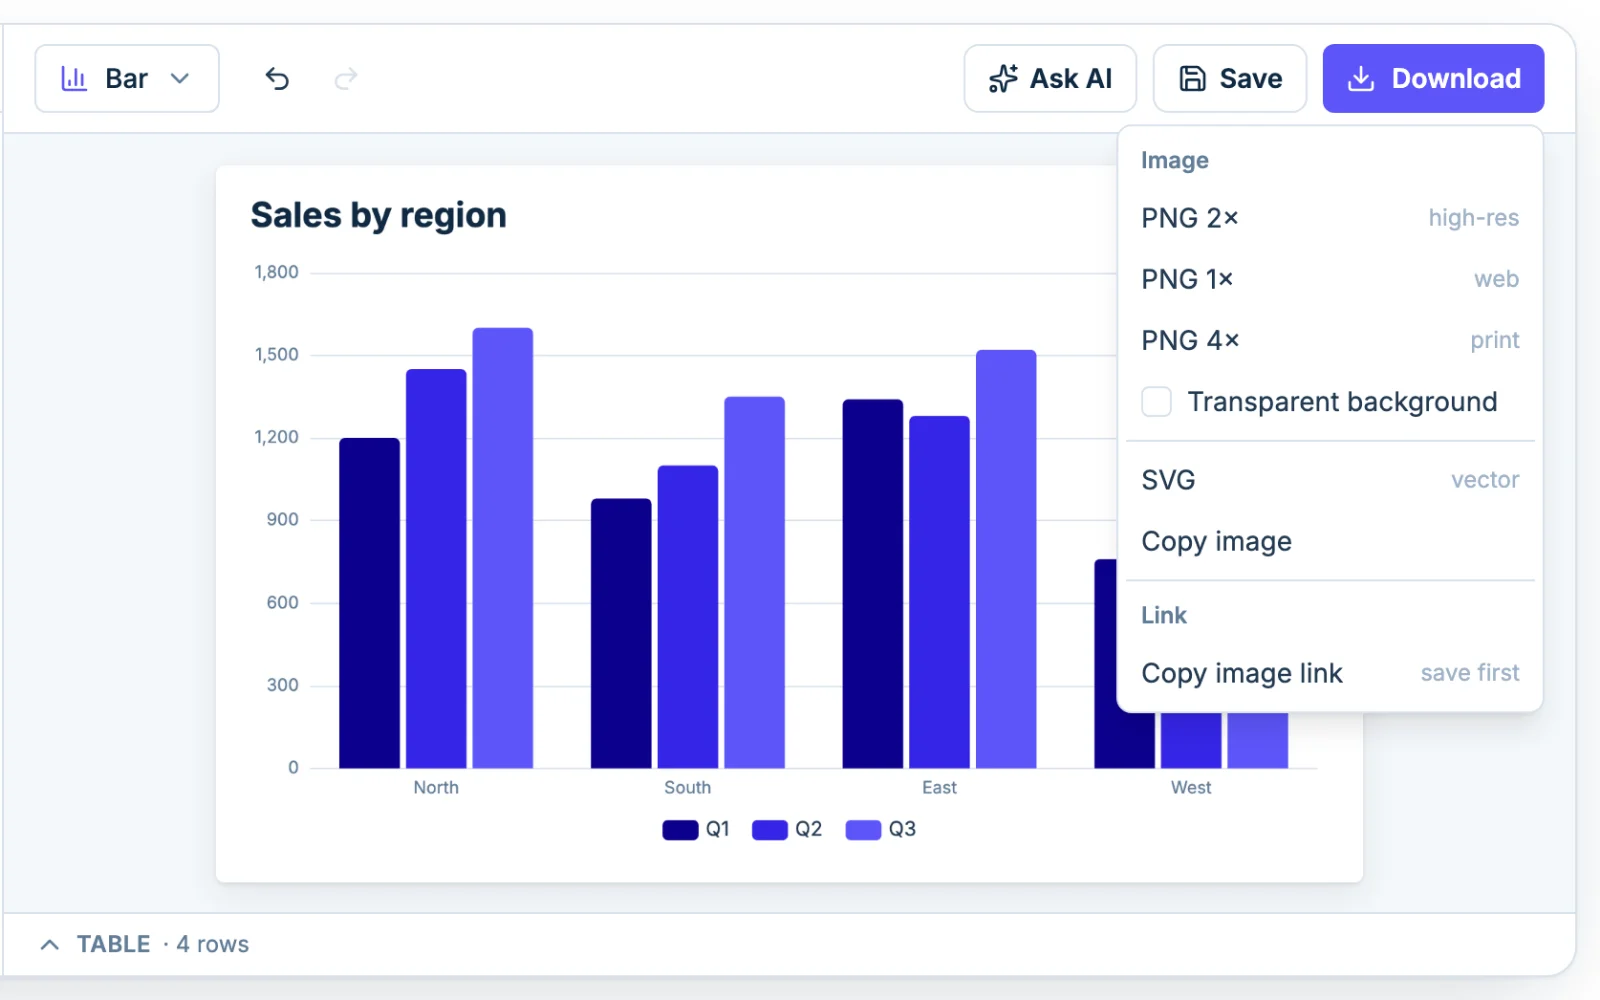
- Choose Download, then Copy image link.
- Paste the link wherever a picture can be added by its web address.
The link is a web address that ends in .png. Anything that can show a picture from the web can show your chart from it. The picture is twice the chart's size in pixels, so it stays sharp on a phone.
If the menu says "save first" beside Copy image link, the chart is not saved yet. Choose Save, then copy the link. For a picture with no background, tick Transparent background in the same menu before you copy.
Add the chart to a Notion page
Type /image and press Enter. Choose to embed an image from its link, and paste the link you copied. Notion's help page on images, files and media has more on embedding an image from a link.
Add the chart to an email or newsletter
In a newsletter or email tool, add an image and look for the option to use the image's web address. It is often called image URL. Paste the link there. If you write the HTML of the email yourself, the link goes in an image tag:
<img src="https://chartjuice.com/img/7b0c9f1e-6c1d-4c57-9a47-2f1f0a3b8e21.png?kid=3d2a1b0c-9e8f-4a7b-8c6d-5e4f3a2b1c0d&scale=2&sig=d2bd5b97a1f538c7cb8c860665879d38b7d5a75248202d534d21c3ed3cf0931f" alt="Monthly sales" width="800">Put the same tag on a web page to show the chart there.
What the link shows
The picture is your chart as it is saved now. It is a still image, so there is nothing in it to hover over or click.
When does the picture update?
Edit the chart and the picture changes with it, within about 5 minutes. You never have to copy the link again.
Notion, mail services and browsers fetch the picture from the link when someone looks at it. That is why an email you already sent can show the edited chart the next time someone opens it. Some services keep a copy of their own for a while, so an edit can take longer to show there.
Who can see the picture?
Anyone who has the link can see the picture, without signing in. That is what lets it work in an email. The link shows that one chart as a picture and nothing more. Nobody can use it to open the chart, read its data, change it or find your other charts. A link can't be altered to show a different chart either, because it is signed: the long sig at the end only fits the link it was made for.
On the Free plan
Linked images carry a small chartjuice.com mark, as Free downloads do. Pro removes it. Pricing has the plans.
How views are counted
Each plan includes image renders: 100 a month on Free and 1,000 a month on Pro. A render is one drawing of a picture. A picture is counted the first time it is drawn in a month, and not again that month, however many people look at it.
A link counts once each time its chart changes, and once at the start of each month. A newsletter with one chart in it uses one render, whether ten people open it or ten thousand. Saving a chart again without changing it does not count, because the picture is the same.
When the month's renders are used up, a link whose picture has not been counted yet shows a grey picture that says "Chart unavailable" until the 1st of the next month. Links whose pictures were already counted this month keep working. Limits and errors has more on the counts.
Turn a link off
A link works for as long as its chart exists and the key it was signed with is active. To stop your links, open your account page, find Image signing keys, and choose Rotate. Every link you copied before that stops working and shows "Chart unavailable". Links you copy afterwards work. Deleting a chart stops the links to it.
A link does not stop at the same instant everywhere. A copy of the picture that was already loaded can linger for up to 5 minutes, and longer in mail apps that keep their own copy.
Use a chart as a template
Design a chart once in the editor, then send it new numbers whenever you need the picture. The image comes back in the chart's own design: its type, colors, title and sorting. The saved chart is not changed.
This takes an AI assistant or a little code. It is the first of the image API's three calls, and each one answers with a picture or a link to one. With an assistant connected to Chartjuice, ask in plain words, such as "Draw my Monthly sales chart with these numbers", and paste the numbers.
In code, send the data to the chart's render address. You need an API key, which the API reference explains. Put your chart's id in place of the one in the address:
curl -X POST "https://chartjuice.com/api/v1/charts/7b0c9f1e-6c1d-4c57-9a47-2f1f0a3b8e21/render" \
  -H "Authorization: Bearer $CHARTJUICE_API_KEY" \
  -H "Content-Type: application/json" \
  -d '{
  "data": [
    {
      "Month": "Apr",
      "Sales": 6300
    },
    {
      "Month": "May",
      "Sales": 7100
    }
  ],
  "scale": 2
}' \
-o chart.pngThe new data needs the same column names as the chart's own data. This chart was made from columns called Month and Sales, so the new rows have a Month and a Sales. Columns can come in any order, and extra columns are fine. If a column the chart is drawn from is missing, the answer is invalid_request and names the columns it needs.
The answer is the picture itself, as a PNG. Add "format": "svg" for an SVG, "scale": 2 for twice the size, or "width" and "height" for a canvas of another size. Render a chart with new data in the reference has every field.
Each different picture is one image render. Send the same data again in the same month and you get the picture again, and it is not counted a second time.
Draw a chart from data alone
When there is no saved chart, describe one in the request: a chart type and your data. Nothing is saved to your account, so this does not count toward the Free plan's saved charts.
curl -X POST "https://chartjuice.com/api/v1/render" \
  -H "Authorization: Bearer $CHARTJUICE_API_KEY" \
  -H "Content-Type: application/json" \
  -d '{
  "type": "bar",
  "data": "Month,Sales\nJan,4200\nFeb,5100\nMar,4800",
  "ops": [
    {
      "op": "setTitle",
      "title": {
        "text": "Monthly sales"
      }
    }
  ],
  "scale": 2
}' \
-o chart.pngops are chart edits, the same edits the editor makes. Here one sets the title. To get the picture inside JSON, with the image base64-encoded, send the header Accept: application/json. Render a chart from data in the reference has every field, and shows how to send a whole chart spec in place of a type and data.
This is counted the same way: one image render for each different picture in a month. If a chart can't be drawn, nothing is counted.
Get an image link from code
The call behind Copy image link is in the API too. It answers with the link for a chart:
curl -X POST "https://chartjuice.com/api/v1/image-urls" \
  -H "Authorization: Bearer $CHARTJUICE_API_KEY" \
  -H "Content-Type: application/json" \
  -d '{
  "id": "7b0c9f1e-6c1d-4c57-9a47-2f1f0a3b8e21",
  "scale": 2
}'{
"url": "https://chartjuice.com/img/7b0c9f1e-6c1d-4c57-9a47-2f1f0a3b8e21.png?kid=3d2a1b0c-9e8f-4a7b-8c6d-5e4f3a2b1c0d&scale=2&sig=d2bd5b97a1f538c7cb8c860665879d38b7d5a75248202d534d21c3ed3cf0931f",
"expires_at": null,
"chart": {
"id": "7b0c9f1e-6c1d-4c57-9a47-2f1f0a3b8e21",
"name": "Monthly sales",
"type": "bar",
"url": "https://chartjuice.com/charts/7b0c9f1e-6c1d-4c57-9a47-2f1f0a3b8e21",
"created_at": "2026-10-10T14:03:12.481923+00:00",
"updated_at": "2026-10-10T14:05:40.118264+00:00"
}
}Add "data" for a link that draws the chart with that data in place of its own. The data travels inside the link, so it has to be short: up to 4,000 characters once encoded, which is about 3,000 characters of CSV. Add "expires_in" with a number of seconds for a link that stops working after that long.
Making a link costs nothing. A render is counted when the link's picture is first drawn.
Sign a link yourself
You only need this if your code makes many links and you would rather not ask the API for each one. A link is an address with a signature on the end, and the signature can be worked out anywhere that has your signing secret.
Get a signing key
On your account page, under Image signing keys, choose Add a key. If you have none yet, the button says Make a key. Then choose "Show secret, for signing links yourself" under the key. The page shows the key's id and its secret. Copy the secret then, because it is shown once. If you lose it, add another key. Keep it like a password: anyone who has it can make a link to any of your charts. An account can have 3 active keys.
Build the link
- Start with the address of the picture:
https://chartjuice.com, then/img/, the chart's id, and.pngor.svg. - Choose the parameters you want from the table below.
kid, the key's id, is always one of them. - Sort the parameters by name and join them as
name=value, with&between them. - Work out the HMAC-SHA256 of that address, a
?and those parameters, with the secret as the key. Write it in hex, in lower case. - Add
&sig=and that signature to the end.
The link has to be written exactly as it was signed: the parameters in name order, sig last, and nothing added. A link with an extra parameter, or with the same parameters in another order, is refused. So is a link with any part percent-encoded, such as %2E for the dot: every character in a link is a letter, a digit, - or _, so nothing needs encoding.
The signature covers the site's address too. Write it as https://chartjuice.com, in lower case and with nothing after it but the path.
| Parameter | Value | What it does |
|---|---|---|
| kid | The key's id | Which signing key the link is signed with. Always there. |
| scale | 1, 2 or 4 | PNG only: how many times the chart's size the picture is. Left out, it is 1. |
| width | 100 to 4000 | The canvas width in pixels, in place of the chart's own. |
| height | 100 to 4000 | The canvas height in pixels, in place of the chart's own. |
| transparent | 1 | Leave out the background. Left out, the chart keeps its background. |
| exp | Unix time, in seconds | When the link stops working. Left out, it works until its key is rotated or revoked. |
| data | base64url text | Other data to draw the chart with: CSV with a header row, or JSON rows, encoded as base64url with the = padding left off. Its columns are matched to the chart's by name. |
A worked example
Take a secret made up for this page, 5f1d3c9a7b2e4f60819a2b3c4d5e6f708192a3b4c5d6e7f8091a2b3c4d5e6f70, a key whose id is 3d2a1b0c-9e8f-4a7b-8c6d-5e4f3a2b1c0d, and the chart 7b0c9f1e-6c1d-4c57-9a47-2f1f0a3b8e21. For a PNG at twice the chart's size, this is the text that is signed:
https://chartjuice.com/img/7b0c9f1e-6c1d-4c57-9a47-2f1f0a3b8e21.png?kid=3d2a1b0c-9e8f-4a7b-8c6d-5e4f3a2b1c0d&scale=2Its HMAC-SHA256 with that secret is:
d2bd5b97a1f538c7cb8c860665879d38b7d5a75248202d534d21c3ed3cf0931fSo the link is:
https://chartjuice.com/img/7b0c9f1e-6c1d-4c57-9a47-2f1f0a3b8e21.png?kid=3d2a1b0c-9e8f-4a7b-8c6d-5e4f3a2b1c0d&scale=2&sig=d2bd5b97a1f538c7cb8c860665879d38b7d5a75248202d534d21c3ed3cf0931fIn JavaScript and Python
Both read the key's id and secret from two environment variables, so the secret is never written into a file. Both print the link.
import { createHmac } from 'node:crypto'

const site = 'https://chartjuice.com'
const chart = '7b0c9f1e-6c1d-4c57-9a47-2f1f0a3b8e21'
const kid = process.env.CHARTJUICE_IMAGE_KEY_ID
const secret = process.env.CHARTJUICE_IMAGE_KEY_SECRET

// What the image should be. `kid` is always there; leave out the rest for a plain PNG.
const params = { kid, scale: 2, width: 640 }

// Sort the parameters by name, sign the whole address with them, and add the signature.
const address = `${site}/img/${chart}.png`
const query = Object.keys(params).sort().map((name) => `${name}=${params[name]}`).join('&')
const sig = createHmac('sha256', secret).update(`${address}?${query}`).digest('hex')

console.log(`${address}?${query}&sig=${sig}`)What a link answers
A link always answers with a picture, so an email or a page never shows a broken image. When it can't show the chart, the picture is a grey one that says "Chart unavailable", and the HTTP status says why.
| Status | What it means |
|---|---|
| 200 | The chart. |
| 304 | You already have this picture: the request named it with If-None-Match, and the chart has not changed. |
| 400 | The chart can't be drawn as the link asks: its data no longer fits the chart, or the picture would be too large or has too much in it to draw. |
| 403 | The link was changed, was never a link, was made for another site, or its signing key was rotated or revoked. |
| 404 | The chart was deleted. |
| 410 | The link is past the expiry it was given. |
| 429 | The month's image renders are used up and this picture has not been counted yet. Also sent, for a short while, when an account's links are asked for far more often than readers would ask, or to a network that has asked for too many links that do not work. |
| 500 | Something failed on our side. The link is fine: it shows the chart again once that is fixed. |
A chart's picture is kept for 5 minutes by browsers and by our network, so most views never reach the server. A link with an expiry is not kept past it. "Chart unavailable" is not kept at all, so a link that works again shows the chart the next time someone looks.
An SVG link is served as a document that can't run scripts. A PNG is the safer choice for email, where many readers do not show SVG.
Images draw text in the Latin, Greek and Cyrillic alphabets for now. Limits and errors has the size limits an image works within.